
Gas Prices in 1970 — and Every Decade from 1950 to 2010
October 16, 2026
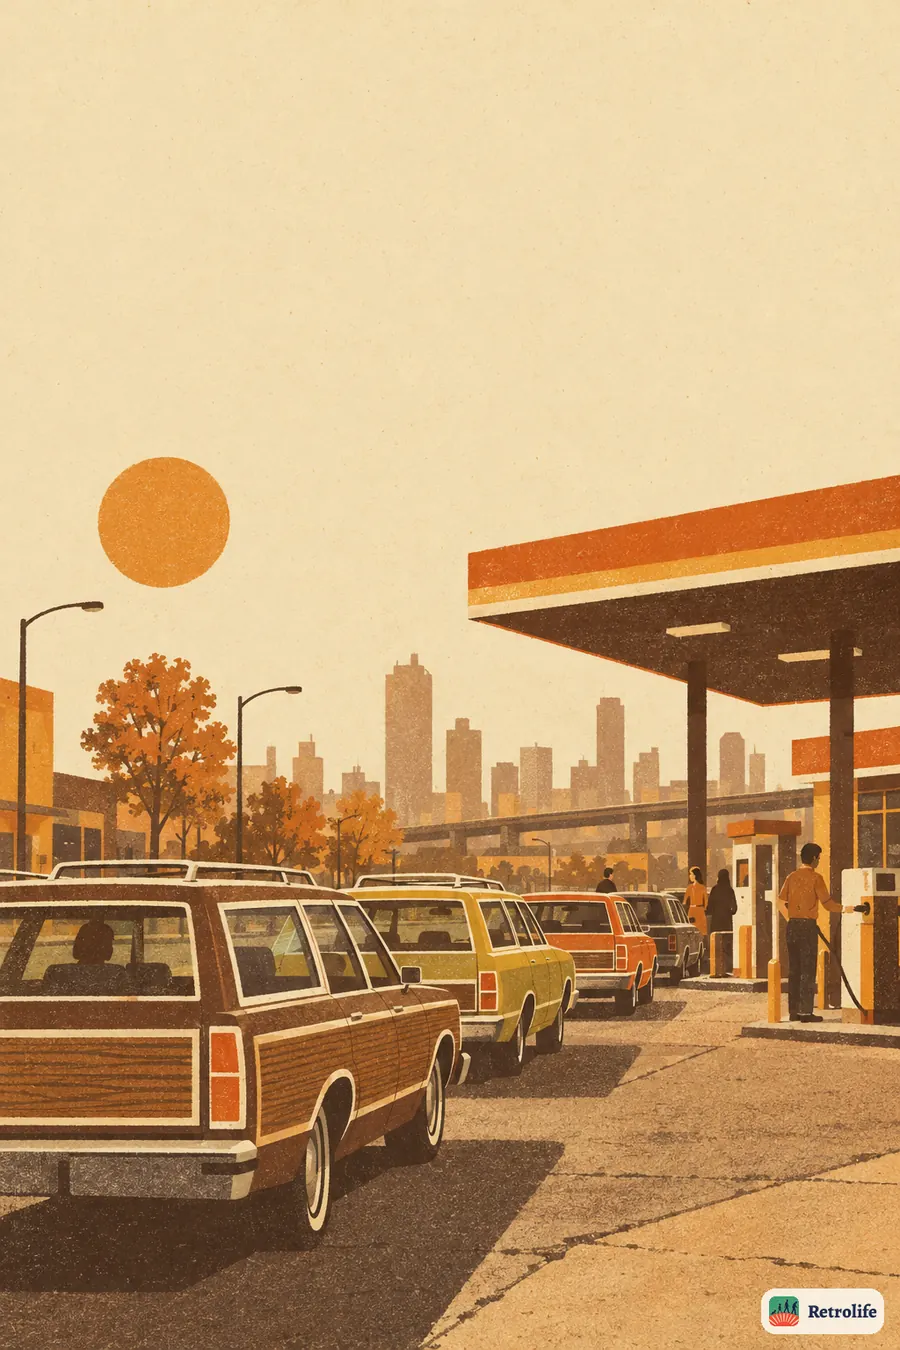
Searching for 1970 gas prices usually gets you one number. Here it is: about 38 cents a gallon. But a number from another era means little without context, so below you will find the price every decade from 1950 to 2010, converted to gallons, set against what people earned.
Cost of gas in 1970
Our game data stores gasoline per litre, because the same table covers America, Germany and the Soviet Union. In the 1970 anchor year a litre of gas cost $0.10 in the USA. A US gallon is 3.785 litres, so the conversion is simple: $0.10 × 3.785 gives roughly $0.38 a gallon.
The same anchor year gives an average monthly wage of $565. Put the two together and a month’s pay bought about 1,490 gallons. For comparison, a loaf of bread was $0.24 and a movie ticket $1.55, so a night at the movies cost the same as about four gallons of gas.

Gas prices every decade, 1950–2010
Same method for every year, all in the dollars of that year (not adjusted for inflation). The price per litre is as it appears in the data, and the per-gallon column is that figure times 3.785.
| Year | Gas, per litre | Gas, per gallon | Average monthly wage | Gallons a month’s wage bought |
|---|---|---|---|---|
| 1950 | $0.07 | $0.26 | $250 | about 940 |
| 1960 | $0.08 | $0.30 | $365 | about 1,200 |
| 1970 | $0.10 | $0.38 | $565 | about 1,490 |
| 1980 | $0.31 | $1.17 | $1,190 | about 1,010 |
| 1990 | $0.31 | $1.17 | $1,780 | about 1,520 |
| 2000 | $0.40 | $1.51 | $2,450 | about 1,620 |
| 2010 | $0.74 | $2.80 | $3,300 | about 1,180 |
A caution before you quote these. The data has anchor years every five years and rounded figures, so read each row as “around that year,” and the decades in between as approximate. Where a year isn’t in the table, the closest anchor stands in for it. For example, the 1975 anchor, after the first fuel shock, shows $0.15 a litre, or about $0.57 a gallon.
Gas versus wages: the real story
The raw price tells you less than the ratio to wages, and the ratio has a plot.
1950 to 1970: gas barely moved. Between those two years, the price per litre went from $0.07 to $0.10, up about 43 percent, while the average wage more than doubled (from $250 to $565). Fuel got cheaper in practice. A month’s pay bought around 940 gallons in 1950 and 1,490 in 1970. This is the stretch of cheap fuel behind the big-car, long-road-trip image of the era.
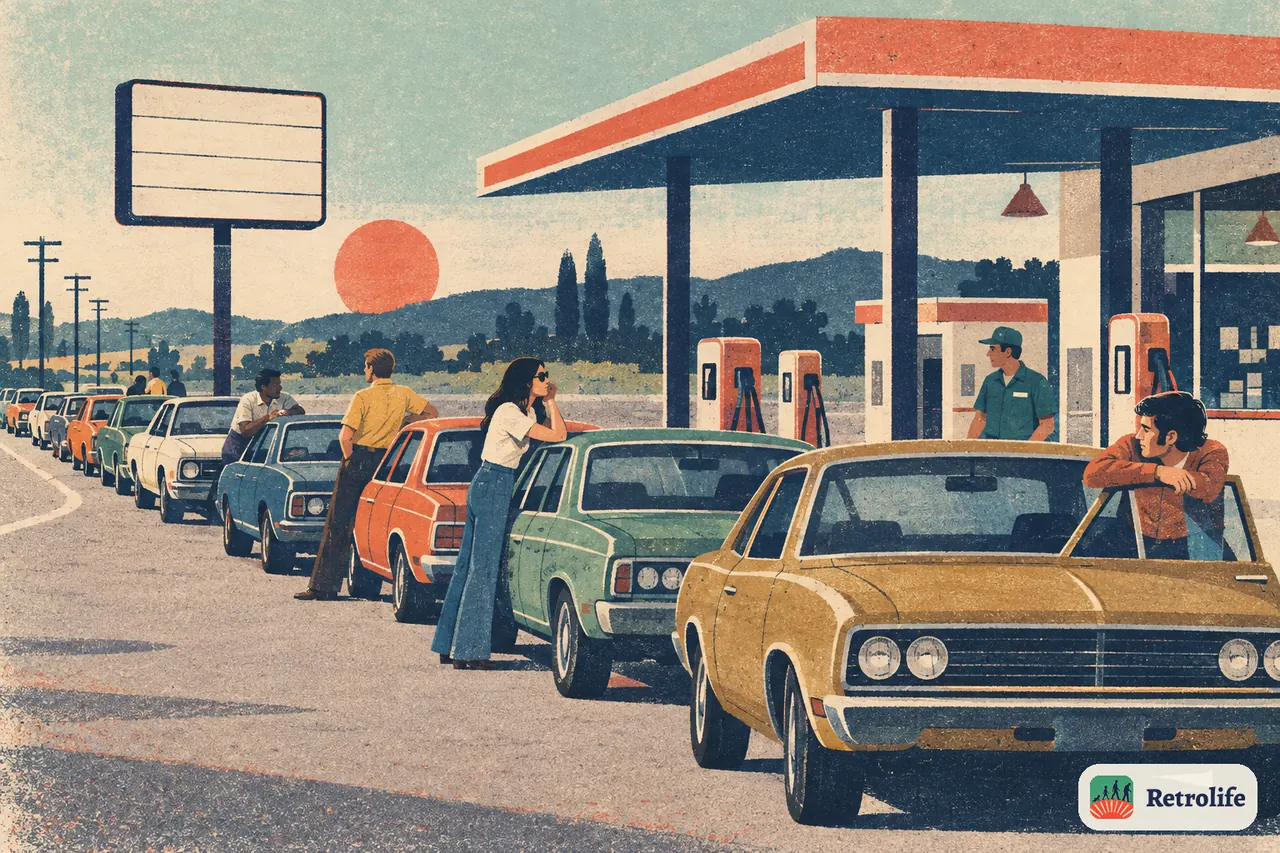
1970 to 1980: the shock. The price per litre tripled, from $0.10 to $0.31, while wages grew a bit more than twofold. The monthly wage bought about 1,010 gallons, a third less than in 1970. Our news lines for these years describe what people lived through: in 1973, “long lines form at gas stations as fuel becomes scarce and expensive,” in 1974 a national 55 mph speed limit “is meant to save fuel on every highway,” and in 1979 “gas lines return in summer as fuel prices climb again.”
1980 to 2000: back to easy. The dollar price held at about $1.17 a gallon from 1980 to 1990 while the average wage grew by half, which lifted a month’s pay back to about 1,520 gallons. By 2000 the figure reached about 1,620 gallons, the best on the list.
2000 to 2010: the squeeze returns. The price per litre almost doubled, and a month’s pay bought about 1,180 gallons by 2010, close to the 1960 level. A 2010 movie ticket ($7.89) cost 2.8 gallons, against about four in 1970. The game’s news line for 2022 is a footnote that feels familiar: “prices of groceries and gasoline climb, and shoppers feel it at every checkout.”
The same shock, seen from Europe
The fuel crisis wasn’t only American. Our West German 1973 news line describes car-free Sundays that “empty the motorways as oil becomes scarce.” If you want the other side of the same decade, our guide to what happened the year you were born shows 1973 as it looked in three countries.

What a tank of gas looked like
Americans had a different relationship with a fill-up in 1970. At 38 cents a gallon, putting 15 gallons in the tank cost under six dollars, roughly one percent of a month’s wage. In 1980 the same tank cost about $17.60, closer to one and a half percent. That sounds small, but it was the first time in a generation that a driver felt the price at every stop. The next time someone tells you gas used to be “so cheap,” ask them which decade.
You are sixteen in 1973 and your dad hands you the keys on one condition: the tank comes back full. You spend a Saturday in a line three blocks long, and for the first time you understand why he keeps checking the little needle.
How this works in Retrolife
In Retrolife the prices are not a footnote. Every year of your hero’s life comes with the real news, the wages and the prices of that era, and the same gas lines show up as part of the story at the age you happen to be. Compare your own decade with others on our postcards, or start with the average salary in 1970 to see what else that wage covered.
FAQ
How much was a gallon of gas in 1970?
About 38 cents a gallon in our game data, which stores gasoline at roughly 10 cents per litre. Multiply a litre price by 3.785 to get a US gallon.
How much gas could an average monthly wage buy in 1970?
Around 1,490 gallons. The average monthly wage in the data is $565, and 565 divided by $0.38 comes to about 1,490 gallons.
Why were there gas lines in the 1970s?
Fuel became scarce and expensive in 1973, and long lines formed at stations. They returned in the summer of 1979 as prices climbed again.