
Average Salary in 1970 and What It Bought
October 16, 2026
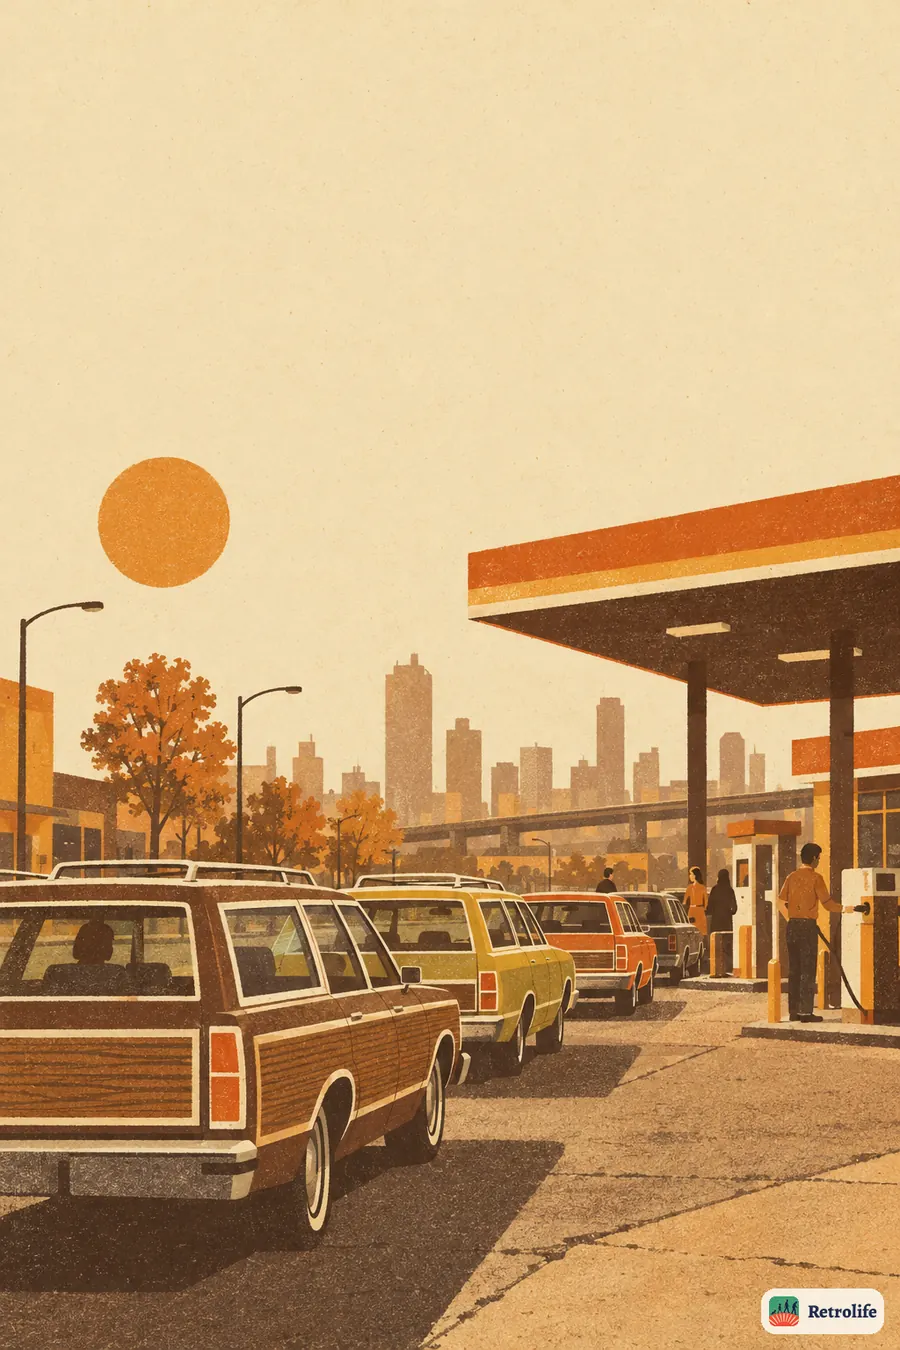
The average salary in 1970 was about $565 a month, or roughly $6,780 a year. The figure only becomes meaningful next to the price tags of the same year, so this article lines up what a month of work paid for, then compares it with 1960 and 1980. Pick another year in the calculator to see any year from 1950 to 2010.
Prices are the nearest round year in the game's data and simplified; for the USSR and GDR they were set by the state, and shortages are not in the numbers.
What an average month’s pay bought in 1970
All of these come from the 1970 anchor year in our game data, in dollars of that year. Milk and gasoline are stored per litre, as everything in the data is, and the table shows both.
| Item | Price in 1970 | A month’s wage ($565) bought |
|---|---|---|
| Loaf of bread | $0.24 | about 2,350 loaves |
| Milk, 1 litre | $0.35 | about 1,610 litres |
| Gasoline | $0.10 per litre, about $0.38 per gallon | about 1,490 gallons |
| Movie ticket | $1.55 | about 365 tickets |
| Rent, per month | $108 | 19 percent of the month’s pay |
| Jeans | $7 | about 80 pairs |
| A TV set | $330 | 0.6 of a month’s pay |
| A car | $2,500 | about 4.4 months of pay |
Two things stand out. First, rent is already a fifth of the paycheck, which is a familiar feeling. Second, a car costs less than five months of average pay, and, as we’ll see below, that ratio hardly moves for decades.

Salary in 1960, 1970 and 1980
The three-snapshot view is where the story is. The monthly wage, with what it bought:
| Year | Monthly wage | Annual (x12) | Loaves of bread | Rent as share of wage | Car in months of pay |
|---|---|---|---|---|---|
| 1960 | $365 | $4,380 | about 1,830 | 19 percent | 5.5 |
| 1970 | $565 | $6,780 | about 2,350 | 19 percent | 4.4 |
| 1980 | $1,190 | $14,280 | about 2,330 | 20 percent | 4.6 |
The wage rose 55 percent in the 1960s and then 111 percent in the 1970s, which looks spectacular until you compare it with prices. Between 1970 and 1980 a loaf of bread went from $0.24 to $0.51, so the loaves a month’s pay could buy did not grow at all. The 1970s were a decade of bigger numbers on both sides of the receipt. Rent held at 19 to 20 percent of pay all the way through. By 2010 the data shows it at 26 percent.
A note on the TV: in the data a set costs $150 in 1965 and $330 in 1970. That jump probably reflects the switch to color, since by autumn 1966 nearly every prime-time program was in color and black-and-white sets looked old overnight. By 1980 a TV was down to 0.3 of a month’s pay.
How people lived on it
The price list doesn’t describe the daily life, so here is what the news lines for these years tell you about 1970 and its neighbors. In 1969, millions gathered around their television sets to watch the first people walk on the Moon. In 1970 came the first Earth Day, with clean-ups and tree planting. In 1972, video games arrived in bars and arcades, and a bouncing dot drew crowds, which is where some of the pocket money started to go.

Life expectancy at birth in the 1970 data is 67.1 years for men and 74.7 for women. In 1950 it was 65.6 and 71.1. The numbers are for the country as a whole, so they say nothing about any single household.
Salary by decade, in plain terms
If you want a quick mental model of the numbers, here is how the average monthly wage in the American data grows. In 1950 it is $250, in 1960 $365, in 1970 $565, in 1980 $1,190, in 1990 $1,780, in 2000 $2,450 and in 2010 $3,300. Multiplied by twelve, that is $3,000 a year in 1950, $6,780 in 1970 and $39,600 in 2010. The curve is steeper in the 1970s than in any other decade, and the price comparison above shows why that is not the whole story.
What this number does not tell you
“Average” hides a lot. It does not tell you what a nurse, a machinist or a teacher earned, and it says nothing about where people lived, since a month’s pay stretches differently in a small town than in a big city. Treat the table as a ruler for comparing decades, not as a budget for a specific family. Also remember that the game’s data uses anchor years every five years, with rounded numbers, so the 1970 column is the 1970 anchor and the neighbor years are approximate.
You get your first paycheck at nineteen: about $565 for the month. Rent takes a fifth, a movie night eats a few dollars, and you work out that a new TV would take a bit more than half of it.
How this works in Retrolife
In Retrolife your hero’s wage and prices come straight from this kind of table, year after year, so a raise or a rent hike feels like it belongs to the era. You pick one of 39 professions, and the prices of the decade decide how far your paycheck goes. To see what the gas side of the budget did, read gas prices in 1970 and every decade since. Or send someone a postcard from their favorite decade.
FAQ
What was the average salary in 1970?
About $565 a month in our game data, which comes to roughly $6,780 a year. That is the average wage across the economy, not what any single job paid.
How much was rent in 1970?
Around $108 a month in the data, close to 19 percent of the average monthly wage.
How many loaves of bread did an average wage buy in 1970?
About 2,350. A loaf cost $0.24, and $565 divided by $0.24 is about 2,354.